Read the executive summary report
Open, interpret, and share the executive summary for a phishing campaign so leadership sees risk and your team knows what to do next.
The executive summary is the report you send to leadership after a phishing campaign closes. It rolls up click rate, reporting behavior, an overall risk level, recommended next steps, and the list of employees who clicked — all on one page, all suitable for a board deck or a CISO update.
You'll typically read it as the org admin who ran the campaign, then forward it to an executive sponsor who wants the headline answer: "Are we getting better, and where do we still have a problem?"
Find your report
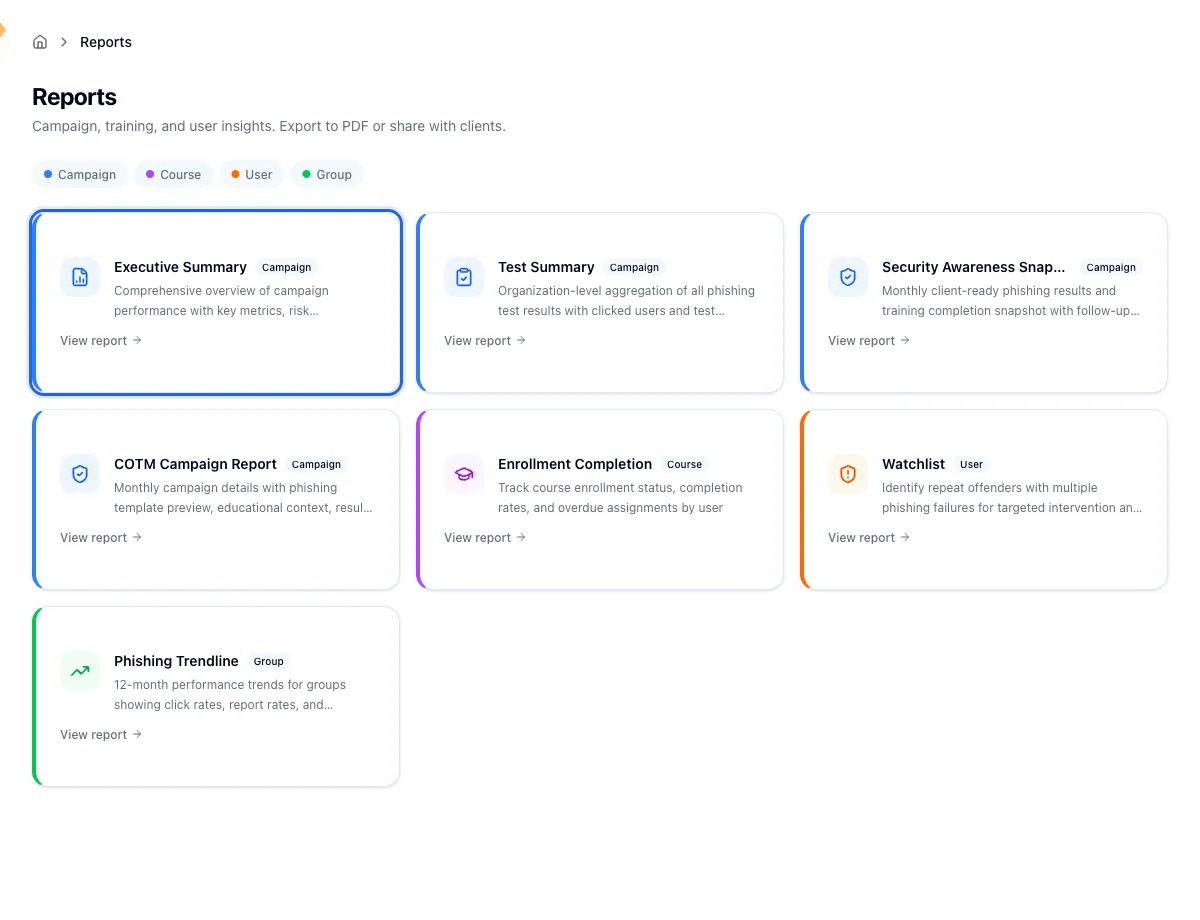
From the left sidebar, open Reports. The report hub lists every available report type as a card.
Click Executive Summary in the Campaigns category.
Pick the campaign you want to read. The list is sorted by most recent first; use the search box or the Active / Completed / Draft / Scheduled chips to narrow it down.
The report opens at /org/reports/executive-summary/<campaign-id>. Bookmark
it — that URL is stable, so you can link an exec back to the same campaign
later.
What each section shows
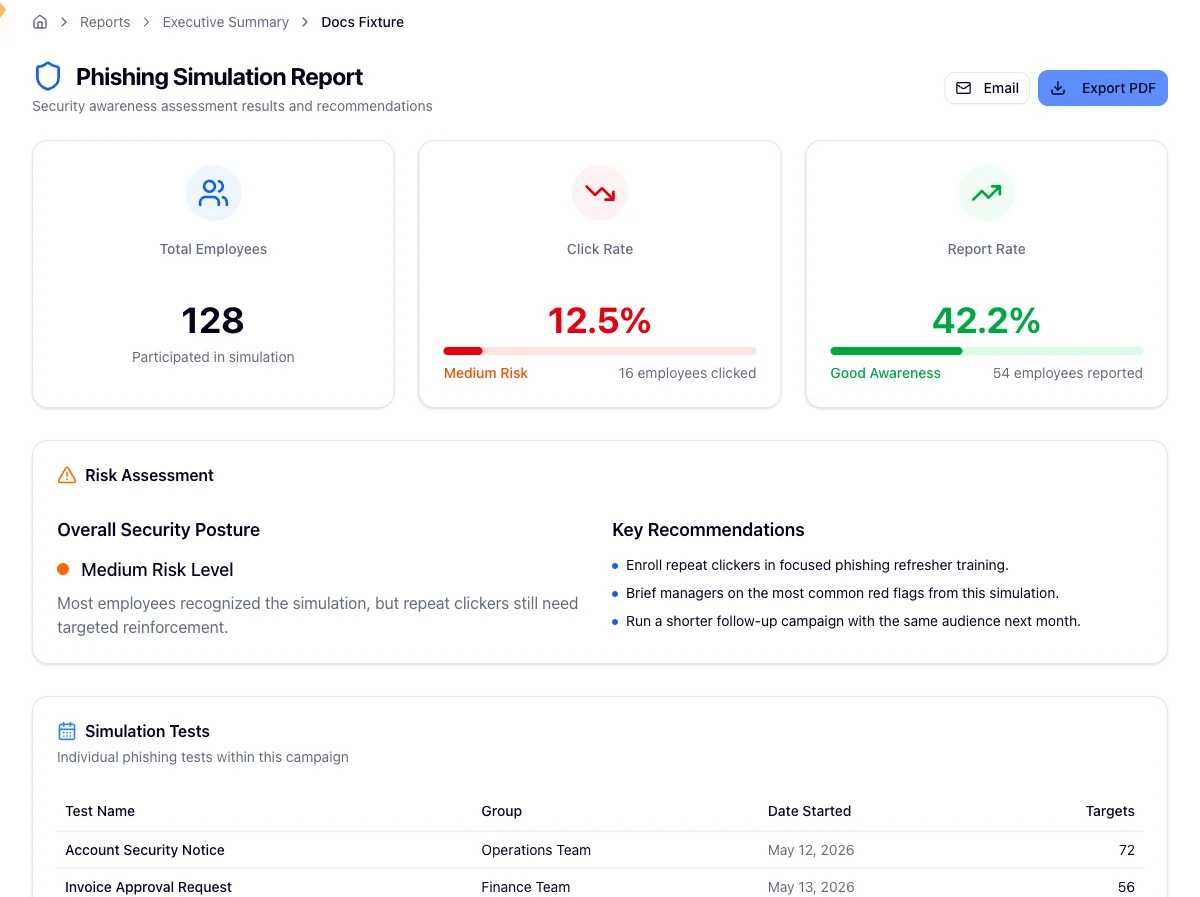
Key metrics: Total Employees, Click Rate, Report Rate
The three tiles at the top are the headline. Total Employees is the count of people who participated; for recurring campaigns it also shows the number of simulations and total emails delivered. Click Rate is the percentage of recipients who clicked the phishing link. Report Rate is the percentage who used the report-phish button to flag the email — only shown when at least one person reported.
The Click Rate tile is color-coded as High (above 15%), Medium (5–15%), or Low (under 5%). Report Rate is labeled Good Awareness, Moderate Awareness, or Low Awareness based on the same data.
What good looks like
Strong programs show click rates trending down over consecutive campaigns, and report rates trending up — even if the absolute numbers aren't world-class yet. A single campaign is a snapshot; the trend across campaigns is the story.
AI-generated insights
Below the tiles is an AI Insights panel that reads the campaign data and produces a short narrative — what stood out, where the risk concentrates, and what to prioritize. Treat it as a starting point for the conversation with leadership, not a final verdict.
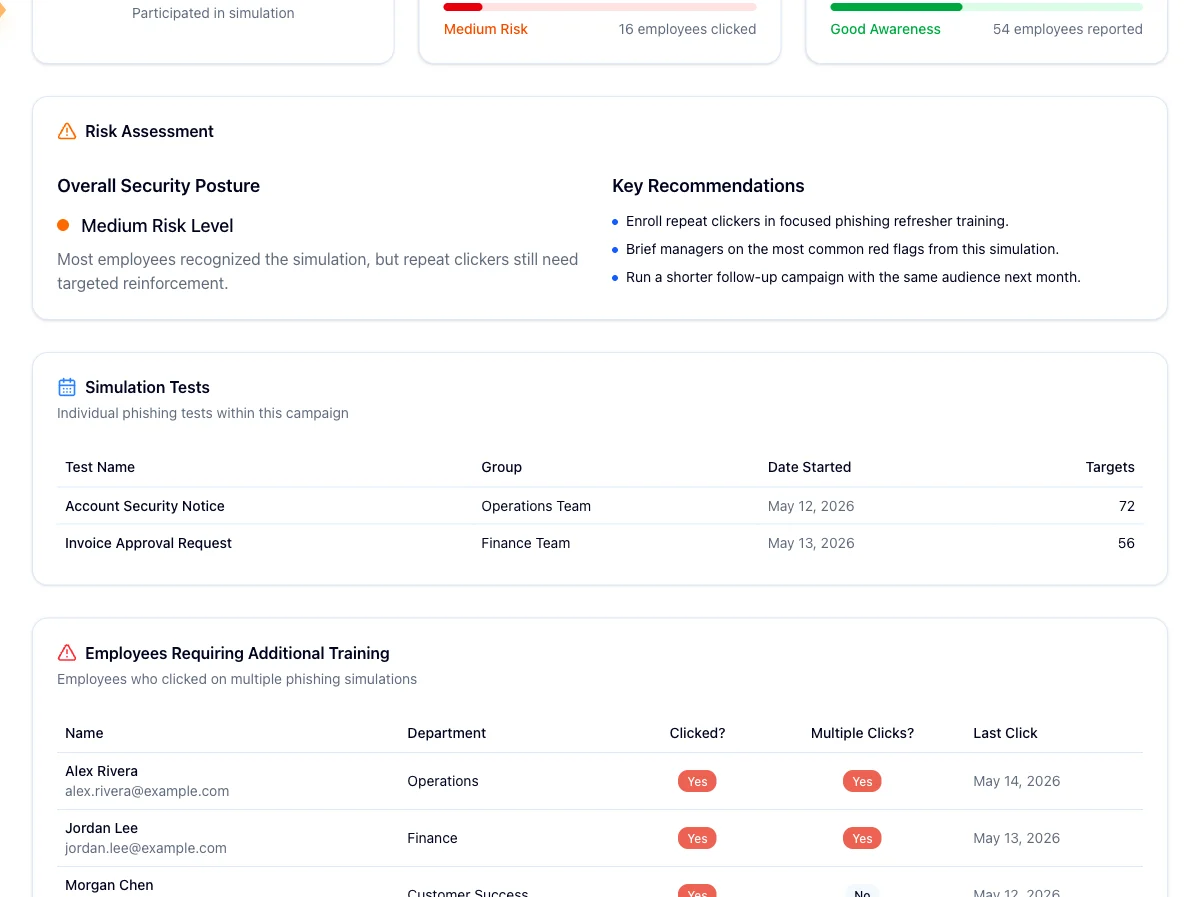
Risk Assessment
This card pairs an Overall Security Posture verdict (High / Medium / Low Risk) with a short description of why, and a Key Recommendations list on the right. The recommendations are auto-generated from the campaign result and are the fastest path from "report" to "action item."
Red flags to watch for
- Click rate trending up across consecutive campaigns
- A small group of repeat clickers driving most of the risk
- Report rate near zero — your reporters are your early-warning system
Simulation Tests
For campaigns that ran multiple tests (different templates, different target groups, or recurring sends), this table breaks out each individual test by name, group, start date, and target count. Use it when an exec asks "which template tripped people up?" — you can point at the row.
Employees Requiring Additional Training
The bottom table lists everyone who clicked, with department, whether they clicked once or multiple times, and the date of their last click. "Multiple Clicks" is the column that matters most — those are the people who need a follow-up enrollment, not just an awareness reminder.
Share or export
Two buttons sit in the top-right of the report:
- Email opens a dialog to pick which org users should receive the report. Recipients get the rendered report in their inbox — useful for the exec who wants it pushed to them rather than logging in.
- Export PDF generates a print-ready version of the report. Use this for board decks, compliance evidence, or attaching to a Linear issue.
If you'd rather the report show up automatically every month or quarter, set up a recurring delivery instead — see Automate report delivery.
What to do next
- Enroll repeat clickers in training. Take the names from the Employees Requiring Additional Training table and assign them targeted training — see Assign training to groups.
- Schedule the next campaign. A single result isn't a trend. Queue up the next phishing campaign now so the comparison data exists in 30 days — see Run a phishing campaign.
- Brief your executive sponsor. Email or PDF the report, then walk them through the three KPI tiles, the risk level, and your one-line plan. Two minutes is enough.
Related
Browse the reports catalog
Navigate the Reports hub — the four report categories, how to filter, and which report answers which question — then jump to the one you need.
Run the Test Summary report
Drill into a single phishing test's funnel — sent, delivered, opened, click rate, report rate — and optionally include the list of users who clicked in the export.